Writing · Archive
In Search of the Perfect Palette
- Published
- Updated
- Tags
- data science, R, data vizualisation, color, color blindness
Three types of palettes:
-
discriminate
-
qualitative
-
smooth
The {ggplot2} default colors
ggplot(mpg, aes(displ, hwy)) +
  geom_point(aes(color = class)) +
  geom_smooth()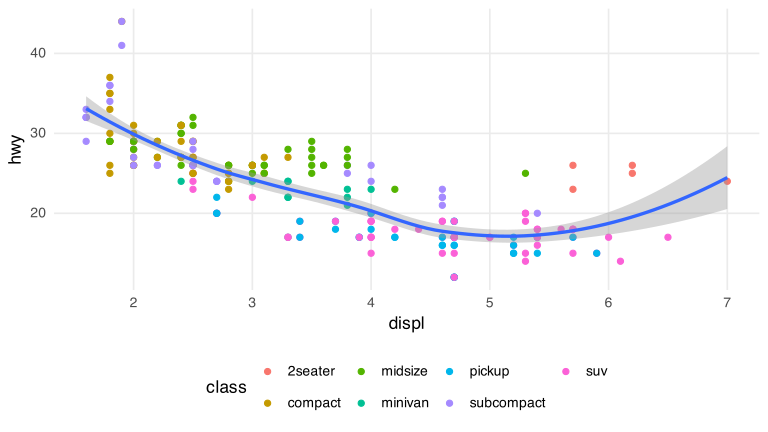
-> not color blindness friendly
Quick switch to Okabe-Ito
ggplot(mpg, aes(displ, hwy)) +
  geom_point(aes(color = class)) +
  geom_smooth() +
  scale_colour_manual(values = palette.colors(palette = "Okabe-Ito"))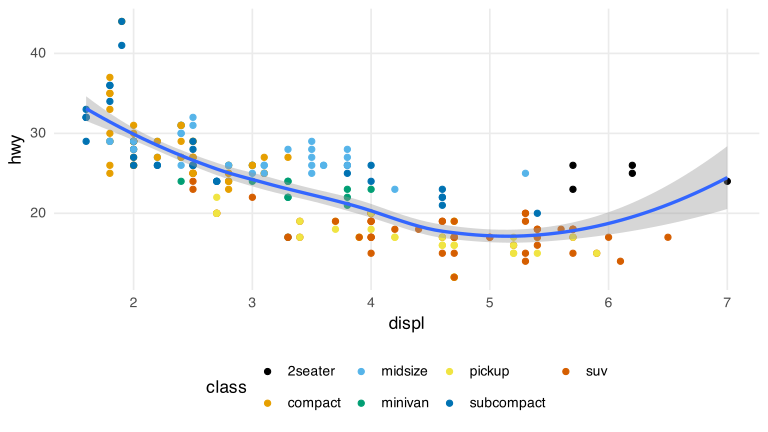
The Nature standard in academic publishing. See Wong (2011).
The same in Python
import matplotlib.pyplot as plt

# Okabe-Ito as the default colour cycle (built into matplotlib 3.11+)
okabe_ito = plt.colormaps["okabe_ito"].colors
plt.rcParams["axes.prop_cycle"] = plt.cycler(color=okabe_ito)
import pandas as pd
mpg = pd.read_csv(
"https://raw.githubusercontent.com/tidyverse/ggplot2/main/data-raw/mpg.csv"
)
for cls, d in mpg.groupby("class"):
plt.scatter(d.displ, d.hwy, label=cls)
plt.legend()
plt.show()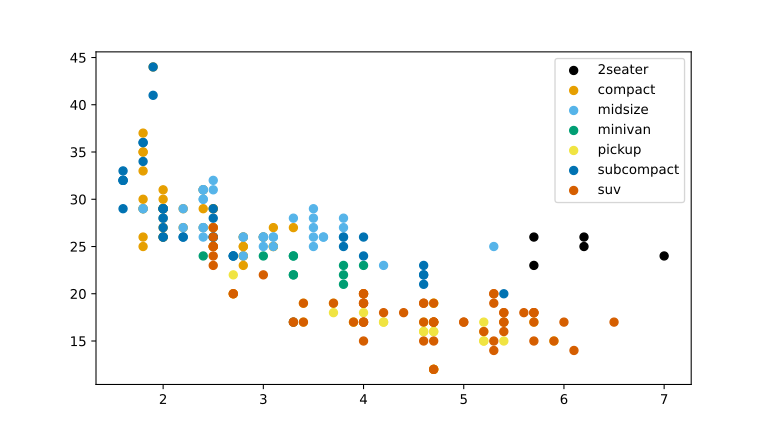
Wong, Bang. 2011. “Points of View: Color Blindness.” Nature Methods 8(6): 441–441. doi:10.1038/nmeth.1618.